
Regular high load every 7 hours: Finding out how Linux measures load value.
We recently decided to make our DNS infrastructure inside each of our core data centers more robust and therefore installed three virtual servers on three different hypervisors to function as DC-local recursive DNS servers. We chose an unbound DNS recursive resolver for this task, as we had positive experience with it from the past and we already had collected scripts for its performance monitoring, as well as the necessary puppet modules.
Having everything prepared, we were able to install the machines pretty quickly, but it took us some time to actually start using them. So, the virtual machines were sitting there, doing nothing ... except, from time to time, we received an alert email that their load was above a configured threshold. When inspecting the plots, we noticed a one-minute load as high as seven or eight. Yes, these were one-CPU virtual servers with 2GB of RAM, but even with one CPU you should be able to handle doing nothing, right? The first time we received the notification email, we were surprised, but thought it was just a temporary glitch on the hypervisor itself. But then it happened on another host in a different DC, and as it turned out, it started to occasionally happen on all the virtual servers in all the datacenters – at different times.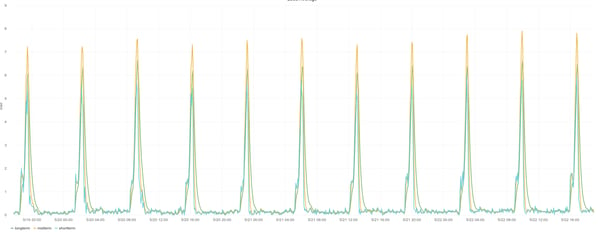
While investigating the situation, we noticed a pattern: it seemed that the load spikes happened every seven hours. This was very strange, as we were not aware of anything being run on hosts at that interval and these hosts were really not in production yet, so we were quite sure that this was not being caused by external applications.
Since the only real trouble was that we were receiving "false" positives from the monitoring system on non-production hosts, we postponed the investigation a bit and gathered some data. Usually, when you see high load on an otherwise unloaded machine, the reason is one of the following:
Even though we did not know where the load was coming from, its regularity directed us to check if:
The situation seemed to require more in-depth analysis. First, we needed to check what the Linux load average really meant and how it was being measured.We already knew that the load value basically describes how many "runnable" (i.e. being able to run and not sleeping or waiting for some network communication) or "blocked in IO waited" processes are in the system. But this time, we needed to really check the kernel source code. We run CentOS 6 on the machines, which means the 2.6.32 edition of the kernel (with quite a lot of backported patches). After downloading the src rpm package, it was time to open kernel/sched.c source code. This is a 12k long file but the interesting part is:
|
#define FSHIFT 11 /* nr of bits of precision */ #define FIXED_1 (1<<FSHIFT) /* 1.0 as fixed-point */ #define EXP_1 1884 /* 1/exp(5sec/1min) as fixed-point */ #define EXP_5 2014 /* 1/exp(5sec/5min) */ #define EXP_15 2037 /* 1/exp(5sec/15min) */ .... .... /* * calc_load - update the avenrun load estimates 10 ticks after the * CPUs have updated calc_load_tasks. */ void calc_global_load(void) { unsigned long upd = calc_load_update + 10; long active; if (time_before(jiffies, upd)) return; active = atomic_long_read(&calc_load_tasks); active = active > 0 ? active * FIXED_1 : 0; avenrun[0] = calc_load(avenrun[0], EXP_1, active); avenrun[1] = calc_load(avenrun[1], EXP_5, active); avenrun[2] = calc_load(avenrun[2], EXP_15, active); calc_load_update += LOAD_FREQ; } |
The value of calc_load_tasks is pushed to the calc_load function, which computes one-min, five-min and 15-min load "averages." The "average" in the load average is actually computed as an exponentially decayed value with different parameters for the one-, five- or 15-minute periods. For some reason, the exponential arithmetic for this case in the kernel is done using integer numbers. This explains the strange, but carefully chosen values of EXP_X. The full explanation is given in this great article, but for the purpose of this post, it is sufficient to know that the load value is exponentially decayed, so the values from previous measurements influence the final value with exponentially decreasing weight.
Also, one important thing to note from the article is that the load average is actually only updated every five seconds.
But, let’s get back to the code. The important thing is to check where the calc_load_tasks are being updated:
|
/* * Either called from update_cpu_load() or from a cpu going idle */ static void calc_load_account_active(struct rq *this_rq) { long nr_active, delta; nr_active = this_rq->nr_running; nr_active += (long) this_rq->nr_uninterruptible; if (nr_active != this_rq->calc_load_active) { delta = nr_active - this_rq->calc_load_active; this_rq->calc_load_active = nr_active; atomic_long_add(delta, &calc_load_tasks); } } |
So really, number of "running" and "uninterruptible" tasks are being summed and put together to create the calc_load_tasks value.
What does this all mean? We measure the load of the machines within a one-minute period via a collectd plugin. To measure a load average of seven or higher, there are several scenarios. Let's discuss two of them:
Stable number of processes (values in five, ten, 15s, etc. are omitted for brevity):
|
time(s) |
prev_load |
accountable_tasks |
next_load_1 |
|
0 |
0.1 |
8 |
0.7 |
|
20 |
2.3 |
8 |
2.8 |
|
40 |
3.9 |
8 |
4.3 |
|
60 |
5.1 |
8 |
5.3 |
|
80 |
5.9 |
8 |
6.1 |
|
100 |
6.5 |
8 |
6.6 |
|
120 |
6.9 |
8 |
7.0 |
In this scenario, the number of accountable processes is stable (eight). If we started with a load value of 0.1, it takes two minutes to get to load seven.
Sudden extreme number of processes:
|
time(s) |
prev_load |
accountable_tasks |
next_load_1 |
|
0 |
0.1 |
100 |
8.1 |
|
20 |
6.4 |
0 |
5.9 |
|
40 |
4.6 |
0 |
4.2 |
|
60 |
3.3 |
0 |
3.0 |
|
80 |
2.3 |
0 |
2.2 |
|
100 |
1.7 |
0 |
1.5 |
|
120 |
1.2 |
0 |
1.1 |
This scenario shows that if there are 100 accountable processes in the moment Linux measures the load, the load_1 value gets boosted to 8 instantaneously and if there are no running processes in other successive measurements, it goes down to one in two minutes.
To find out which of the cases we were facing, we decided to patch the kernel and add more debug messages:
|
--- a/linux-2.6.32-573.22.1.el6.loaddebug.x86_64/kernel/sched.c 2016-05-23 08:53:53.308960747 +0200 +++ b/linux-2.6.32-573.22.1.el6.x86_64/kernel/sched.c 2016-05-23 08:34:17.671848874 +0200 @@ -3230,9 +3230,12 @@ static unsigned long calc_load(unsigned long load, unsigned long exp, unsigned long active) { + unsigned long prev_load = load; load *= exp; load += active * (FIXED_1 - exp); load += 1UL << (FSHIFT - 1); + + printk(KERN_ERR "CALC_LOAD: prev_load: %lu, exp: %lu, active: %lu. New Load: %lu\n", prev_load, exp, active, load >> FSHIFT); return load >> FSHIFT; } |
This revealed that we were facing scenario number two, a very high number of processes, occasionally:
|
May 23 14:14:39 resolver02 kernel: CALC_LOAD: prev_load: 10108, exp: 1884, active: 106496. New Load: 17827 May 23 14:14:44 resolver02 kernel: CALC_LOAD: prev_load: 17827, exp: 1884, active: 106496. New Load: 24927 May 23 14:14:49 resolver02 kernel: CALC_LOAD: prev_load: 24927, exp: 1884, active: 0. New Load: 22931 May 23 14:14:54 resolver02 kernel: CALC_LOAD: prev_load: 22931, exp: 1884, active: 0. New Load: 21095 May 23 14:14:59 resolver02 kernel: CALC_LOAD: prev_load: 21095, exp: 1884, active: 0. New Load: 19406 May 23 14:15:04 resolver02 kernel: CALC_LOAD: prev_load: 19406, exp: 1884, active: 0. New Load: 17852 May 23 14:15:09 resolver02 kernel: CALC_LOAD: prev_load: 17852, exp: 1884, active: 0. New Load: 16422 May 23 14:15:14 resolver02 kernel: CALC_LOAD: prev_load: 16422, exp: 1884, active: 0. New Load: 15107 May 23 14:15:19 resolver02 kernel: CALC_LOAD: prev_load: 15107, exp: 1884, active: 0. New Load: 13897 May 23 14:15:24 resolver02 kernel: CALC_LOAD: prev_load: 13897, exp: 1884, active: 0. New Load: 12784 May 23 14:15:29 resolver02 kernel: CALC_LOAD: prev_load: 12784, exp: 1884, active: 0. New Load: 11760 May 23 14:15:34 resolver02 kernel: CALC_LOAD: prev_load: 11760, exp: 1884, active: 0. New Load: 10818 May 23 14:15:39 resolver02 kernel: CALC_LOAD: prev_load: 10818, exp: 1884, active: 81920. New Load: 16512 May 23 14:15:44 resolver02 kernel: CALC_LOAD: prev_load: 16512, exp: 1884, active: 81920. New Load: 21750 May 23 14:15:49 resolver02 kernel: CALC_LOAD: prev_load: 21750, exp: 1884, active: 0. New Load: 20008 May 23 14:15:54 resolver02 kernel: CALC_LOAD: prev_load: 20008, exp: 1884, active: 0. New Load: 18406 May 23 14:15:59 resolver02 kernel: CALC_LOAD: prev_load: 18406, exp: 1884, active: 0. New Load: 16932 May 23 14:16:04 resolver02 kernel: CALC_LOAD: prev_load: 16932, exp: 1884, active: 0. New Load: 15576 May 23 14:16:09 resolver02 kernel: CALC_LOAD: prev_load: 15576, exp: 1884, active: 0. New Load: 14329 May 23 14:16:14 resolver02 kernel: CALC_LOAD: prev_load: 14329, exp: 1884, active: 0. New Load: 13182 May 23 14:16:19 resolver02 kernel: CALC_LOAD: prev_load: 13182, exp: 1884, active: 0. New Load: 12126 May 23 14:16:24 resolver02 kernel: CALC_LOAD: prev_load: 12126, exp: 1884, active: 0. New Load: 11155 May 23 14:16:29 resolver02 kernel: CALC_LOAD: prev_load: 11155, exp: 1884, active: 0. New Load: 10262 May 23 14:16:34 resolver02 kernel: CALC_LOAD: prev_load: 10262, exp: 1884, active: 0. New Load: 9440 May 23 14:16:39 resolver02 kernel: CALC_LOAD: prev_load: 9440, exp: 1884, active: 102400. New Load: 16884 May 23 14:16:44 resolver02 kernel: CALC_LOAD: prev_load: 16884, exp: 1884, active: 102400. New Load: 23732 |
Please note, that as explained above, kernel uses integer arithmetic to calculate the load, so the values of load and active tasks are actually 2048 higher (F_SHIFT being 11) than what is shown by "top" or "w."
During the affected period, the log shows around 50 active processes every minute for about five seconds and then 55 seconds of silence.
We carefully audited processes that were executed on the machine. Besides the puppet agent executed every 30 minutes (with +-minute random sleep), we noticed that collectd executes all its plugins every minute. And since this was a DNS machine, there were actually some 20 bash scripts to get various performance values from an unbound process. The scripts were rather trivial, but as virtually all the bash scripts in the world, they consisted of a few processes being launched:
|
#!/bin/bash host=${COLLECTD_HOSTNAME:-$(hostname -f)} ds_name=$1 shift ds_type=$1 shift multiplier=${2:-1.0} decimal_places=${3:-0} # get the value val=$(/usr/sbin/unbound-control stats_noreset | grep "^$1=" | cut -d = -f2) # expand scientific notation val=$(printf "%.12f\n" "${val}") # multiply val=$(echo "${val} * ${multiplier}" | bc) # convert to decimal with 12 places # sometimes it returned scientific notation and Zenoss didn't manage that well val=$(printf "%.${decimal_places}f\n" "${val}") echo -e "PUTVAL ${host}/exec-${ds_name}/${ds_type} N:${val}" exit 0 |
Hypothetically, if collectd launched all 20 scripts at once, there could be quite a lot of accountable processes at one moment for a few milliseconds ... that led us to the following idea:
What if this was all some kind of interference? What if kernel measures the load value every seven hours at the exact same moment collectd runs its plugins? And based on the plots, maybe the load measurements hit the high number of processes for a few minutes, but then the load measurement slightly moves after (or before) the collectd plugins are launched and the load decreases after that.
We already had the debug outputs from the kernel and during the analysis, we found out that the time the debug lines are printed differs over time. For example, at around 14:00, the values were measured at ":x9" and ":x4" seconds:
|
May 23 14:15:29 resolver02 kernel: CALC_LOAD: prev_load: 12784, exp: 1884, active: 0. New Load: 11760 May 23 14:15:34 resolver02 kernel: CALC_LOAD: prev_load: 11760, exp: 1884, active: 0. New Load: 10818 May 23 14:15:39 resolver02 kernel: CALC_LOAD: prev_load: 10818, exp: 1884, active: 81920. New Load: 16512 May 23 14:15:44 resolver02 kernel: CALC_LOAD: prev_load: 16512, exp: 1884, active: 81920. New Load: 21750 |
A few hours later, the measurement shifted by one second to ":x0" and ":x5":
|
May 23 16:20:10 resolver02 kernel: CALC_LOAD: prev_load: 886, exp: 1884, active: 0. New Load: 815 May 23 16:20:15 resolver02 kernel: CALC_LOAD: prev_load: 815, exp: 1884, active: 0. New Load: 750 May 23 16:20:20 resolver02 kernel: CALC_LOAD: prev_load: 750, exp: 1884, active: 0. New Load: 690 May 23 16:20:25 resolver02 kernel: CALC_LOAD: prev_load: 690, exp: 1884, active: 0. New Load: 635 |
And what we already suspected by this time, it returned back to ":x9" and ":x4" after ... seven hours!
|
May 23 21:06:39 resolver02 kernel: CALC_LOAD: prev_load: 67, exp: 1884, active: 0. New Load: 62 May 23 21:06:44 resolver02 kernel: CALC_LOAD: prev_load: 62, exp: 1884, active: 0. New Load: 57 May 23 21:06:49 resolver02 kernel: CALC_LOAD: prev_load: 57, exp: 1884, active: 0. New Load: 52 May 23 21:06:54 resolver02 kernel: CALC_LOAD: prev_load: 52, exp: 1884, active: 0. New Load: 48 |
This looked very promising.
We knew that Linux was supposed to measure the load every 5 seconds, but it was time to check it once again in the kernel source, again back in the calc_global_load function:
|
/* * calc_load - update the avenrun load estimates 10 ticks after the * CPUs have updated calc_load_tasks. */ void calc_global_load(void) { unsigned long upd = calc_load_update + 10; long active; if (time_before(jiffies, upd)) return; active = atomic_long_read(&calc_load_tasks); active = active > 0 ? active * FIXED_1 : 0; avenrun[0] = calc_load(avenrun[0], EXP_1, active); avenrun[1] = calc_load(avenrun[1], EXP_5, active); avenrun[2] = calc_load(avenrun[2], EXP_15, active); calc_load_update += LOAD_FREQ; } |
The load is only measured when the current time is higher than calc_load_update+10 jiffies. The +10 seems suspicious here, but it does not influence the future value of calc_load_update and is there just to make sure that the number of active processes (calc_load_tasks) have been recently updated.
What is more important is that after the load is calculated, the calc_load_update gets incremented by the LOAD_FREQ value. And when you check what it means, you will find out that:
|
#define LOAD_FREQ (5*HZ+1) /* 5 sec intervals */ |
So, contrary to the comment there, the load is not measured every 5s (HZ=1000 in CentOS6) but every 5.001 seconds!
Now, let's do the math. If we add one ms every five s, how long does it take to add another full five s? In other words, what is the interference period? We need to add one ms 5000x. If we add it every five s, it takes us 25000s. Which, converted to hours, is: six hours, 56 minutes and 40 seconds. So we were slightly wrong, the spikes did not occur every seven hours.
The regular high load was really caused by launching a bunch of monitoring scripts every minute and by the fact that the load measurements slowly and slightly moves with a period of almost 7 hours.
By the time we knew the cause of the troubles, there were still some questions to be answered. The first one was the most troubling.
Why was it happening only on these hosts when we use collectd everywhere? Or ... no ... could this be happening on every host and we just did not notice?
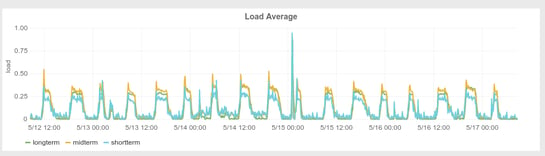
Well, yeah. It turned out that it was really happening everywhere. But to our defense, on a much, much smaller scale. Why? First, most of our machines are much more powerful, so the spike in load is not that big and it does not trigger the threshold for alerts (it is based on load_per_core value). Second, most of the machines actually do something, so you won't notice a small spike in load occurring every ~seven hours in the plot, as the load curve is not stable anyway. And third, the majority of the hosts only have a few collectd exec plugins configured, so the number of processes executed at one moment is significantly smaller.
But, when we looked more carefully, it was evident it is everywhere. Below is a plot of the load average plot of an idle physical machine:
Is it a bug in kernel? No, definitely not! We are sure that the addition of the extra millisecond is there intentionally to cover exactly the cases where there is a very short, but intense work being done. Imagine the load was measured exactly at 5s intervals. Then, a specially crafted workload that would wait for 0.1s, do intense work for 4.8 seconds and then again wait for 0.1 second, would not be visible at all in the load measurements.
Is it a bug in collectd? Well, it is not exactly a bug, it is more that we abused the exec plugin instead of writing the proper plugin in collectd. But, we are about to submit a patch to collectd to add some small random splay when executing Exec plugins anyway.
What should we do? We rewrote the unbound performance monitoring from an exec plugin to its own plugin. No more load warnings in our Icinga!
Is this a collectd-specific issue? Absolutely not, this must be happening everywhere when you execute something relatively short (<5s) regularly.
Have you checked your load plots carefully? :)
1988 - 2026 Copyright © Avast Software s.r.o. | Sitemap Privacy policy